Step By Step: Troubleshooting SQL Server Memory Issue
MSSQL SQL Server Memory, Troubleshooting SQL Server Memory IssueBeing a SQL Server DBA, many a times we do come across SQL server performance issues and try to see from all possible angles to troubleshoot the issue and one of area to look out for is Memory pressure on SQL server and today we are going to discuss the same in this article. Below points to be considered while troubleshooting Memory related issues in SQL server database.
Problem Description:
Application query is running slow and we are identifying the possibility of memory pressure on the database server.
Possible Resolution:
1.First perform the database health check and see active processes running on database server and try to analyze the query plan. Check SQL Server error log for any suspicious error.
2.Next, check the CPU/Memory utilization of the server.
3.Next, try to run perfmon and included some counters to check the current behavior of database server.

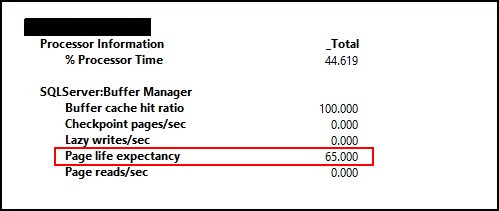
The following performance counters on SQL Server: Buffer Manager object can indicate memory pressure:
- Low Buffer cache hit ratio
- Low Page Life Expectancy
- High number of Checkpoint pages/sec
- High number of Lazy writes/sec
- High number of Page reads/sec
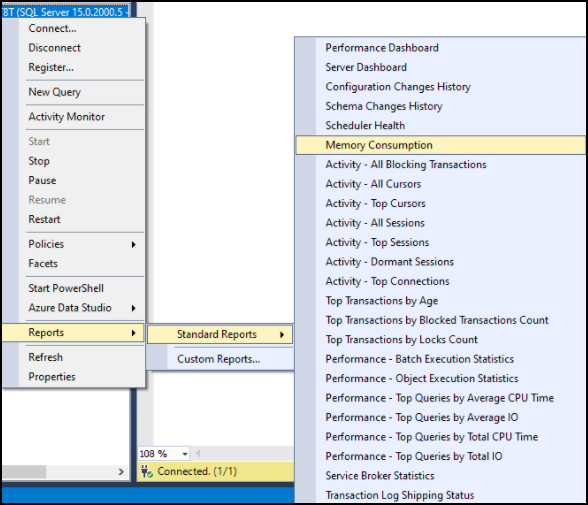
from the above output we see that Page Life Expectancy(PLE) value is constantly very low and this indicates memory pressure on database server. We also ran SQL server generated memory consumption report and see that PLE value is low.


in above result, we can see that memory grants outstanding and pending value is 0(zero) which is good but Page Life Expectancy value(PLE) is low.
4. Now, we know that there is memory pressure on database server, so we can run below query to check which process has acquired more memory and how many queries are currently on hold waiting on memory.
Below query is used to check which process has acquired how much memory(see column, granted_memory_kb)
Memory Grants Query:
SELECT r.session_id
,mg.granted_memory_kb
,mg.requested_memory_kb
,mg.ideal_memory_kb
,mg.request_time
,mg.grant_time
,mg.query_cost
,mg.dop
,(
SELECT SUBSTRING(TEXT,
statement_start_offset / 2 + 1,
(CASE WHEN statement_end_offset = - 1
THEN LEN(
CONVERT(NVARCHAR(MAX),
TEXT)
) * 2
ELSE statement_end_offset
END - statement_start_offset
) / 2)
FROM sys.dm_exec_sql_text(r.sql_handle)
) AS query_text
,qp.query_plan
FROM sys.dm_exec_query_memory_grants AS mg
INNER JOIN sys.dm_exec_requests r
ON mg.session_id = r.session_id
CROSS APPLY sys.dm_exec_query_plan(r.plan_handle) AS qp
ORDER BY mg.required_memory_kb DESC;
Sample Output:

Above query will not display all the running queries, it will only display the queries which need memory grant. Also, pay attention to the column grant_time, if the value of this column is NULL, that means the query is still waiting for the memory grant.
To find out how many queries are currently waiting on a memory grant, run the following query:
SELECT @@SERVERNAME AS [Server Name],
cntr_value AS [Memory Grants Pending]
FROM sys.dm_os_performance_counters WITH (NOLOCK)
WHERE [object_name] LIKE N'%Memory Manager%'
AND counter_name = N'Memory Grants Pending'
Sample Output:

If the Memory Grants Pending Value is 0(zero),this indicates no queries are waiting for memory grants. But if value is on higher side, that means queries are waiting on memory grants and in this case we can run above memory grant query to check which queries have acquired more memory and notify the same to app team for further action.
What is Page Life Expectancy(PLE):
1.PLE is the number of seconds a page will stay in buffer pool. A high PLE value means a page is staying in the buffer pool longer, so SQL Server is less likely to have to go to disk looking for the data page, which makes the query run faster.
2.Server having 4GB RAM, this value should be above 300-400 sec but now a days we have much more memory configured than 4GB, so this PLE value should always be on higher side but it can also depend upon on number of concurrent processes running on the database server.
3.PLE value can be monitored using Perfmon counter and If this value is consistent low (may be in the range of 100 or below), then this indicates memory pressure on the server but this does not indicate that we need to have more memory but rather need to be checked from the database side, as in what is being run during that time that could be causing memory pressure and accordingly culprit query need to be identified. If needed, we can try to run database maintenance ( mostly update stats with full scan) to see if that helps improve the query performance. If that does not help, then finally SQL Server memory can be increased to to see if it helps.
How useful was this post?
Click on a star to rate it!
Average rating 5 / 5. Vote count: 1
No votes so far! Be the first to rate this post.